- AI for Ecommerce and Amazon Sellers
- Posts
- Guide: Measuring Generative Engine Optimization Performance
Guide: Measuring Generative Engine Optimization Performance
Plus new from Reddit & Google
Jo Lambadjieva
October 21, 2025

From Our Sponsor:
Outrank Competition This Holiday Season with Micro-Influencers

The holidays are Amazon’s most competitive stretch - ad costs surge, placements tighten, and only brands that break through early win lasting rank visibility.
Most sellers face the same issues:
PPC costs spike 30–50% in Q4
Rankings freeze on page 2
Reviews trickle in too slowly
That’s where Lenny & Larry’s were stuck - until they used Stack Influence. We activated 1,560 influencers who each:
Bought the product on Amazon (a verified purchase)
Shared honestly on social media
Left organic UGC that the brand could repurpose
The result? 🚀 11× sales, ⭐ 525 reviews, 👀 2.3M impressions - momentum ads can’t buy.
Get ahead of Q4 competition. Outrank your category before Black Friday hits.
Guide: Measuring Generative Engine Optimization Performance
Understanding GEO Performance Measurement
Most marketing teams are creating content for AI systems without any systematic way to measure results. They publish buying guides, optimize for prompts, and hope ChatGPT or Perplexity will recommend them—but have no idea if it's working. The real question isn't whether AI systems mention you; it's whether those mentions create actual demand that converts to revenue.
This guide provides a systematic framework for measuring GEO effectiveness through four interconnected metrics. Unlike traditional SEO that tracks rankings and traffic volume, GEO measurement focuses on demand creation: whether AI recommendations drive branded searches, whether curiosity converts to qualified traffic, and whether your evidence base earns continued recommendations from AI systems.
Core Measurement Philosophy
Track demand creation, not content production - Measure whether people actively seek your brand
Separate brand demand from buyer intent - Monitor both curiosity (branded searches) and conversion (commercial clicks)
Map buying situations to prompts - Connect Category Entry Points to questions people ask AI systems
Require credible evidence - Track not just mentions, but what proof AI systems cite
Cross-reference tool data with reality - Let differences between estimates and actuals teach you about market dynamics
Initial Setup (Complete Once, Review Quarterly)
Before tracking performance, establish your measurement foundation:
Competitive Landscape: Define 3-5 primary competitors at brand and product-line levels. Focus on businesses competing for the same customer in the same buying moments.
Market Parameters: Lock in primary markets and languages. GEO performance varies significantly by geography.
Measurement Windows: Use 13-week rolling windows for trend analysis and 90-day periods for comparative benchmarks.
Ownership Assignment: Assign specific owners for Brand Demand tracking, Buyer Intent analysis, Prompt Visibility testing, and Conversational Query monitoring.
Deliverable: Competitive tracking document with owners, markets, and measurement standards.
The 4-Metric GEO Scoreboard
Track these four metrics weekly. If all four are improving, your GEO is working. If only one is improving, you're executing tactics without strategy. If none are improving, stop creating content and fix your fundamental positioning.
Metric 1: Share of Search (Brand Demand) Your branded search volume as percentage of total category demand versus top competitors
Metric 2: Share of Buyer-Intent Traffic Your portion of non-branded commercial searches compared to competitor estimates
Metric 3: Prompt Visibility Index How frequently and confidently AI systems recommend you across key buying situations
Metric 4: Conversational Query Conversion Volume and conversion rate of natural-language searches, segmented by commercial intent
Metric 1: Share of Search (Your North Star)
Goal: Your brand's share of branded demand rises versus the category.
Weekly Tracking Process:
Use Google Trends to track branded queries:
Monitor your brand name plus 3-5 competitor brands at country level
Cross-check with My Telescope brand demand index and Semrush branded volumes
Calculate your percentage share of total branded search interest
Log the trend slope (up/flat/down) over 13-week rolling window
Note PR coverage spikes and AI recommendation surges that precede lifts
Critical Context:
GEO often affects Share of Search through a verification pattern. When an LLM recommends your brand, users typically Google you to verify before purchasing. This branded search lift is your primary success signal.
Interpretation:
Up → Good. Your brand availability in AI systems is creating market momentum. Continue current approach.
Flat → Warning. AI recommendations may not be translating to consideration. Investigate mention quality and context.
Down → Mobilize PR and communications immediately. Competitors are winning share of mind.
Critical Note: Do not confuse Share of Search with Share of Voice. Different metric, different purpose.
Metric 2: Share of Buyer-Intent Traffic
Goal: Win a larger slice of non-brand commercial clicks.
Monthly Analysis Process:
In Semrush (or equivalent): Estimate non-brand commercial demand by topic for you plus competitors. Focus on queries indicating buying consideration: "best X for Y," "X vs Y comparison," "X pricing," "X reviews."
In Google Search Console: Export non-brand queries and clicks. Segment by intent:
Commercial intent: "best," "vs," "review," "price," "buy," "alternative"
Informational intent: "how to," "what is," "guide," "tutorial," "definition"
Compare proportions: Your actual commercial query clicks versus competitors' estimated share.
Interpretation Matrix:
Brand flat + Buyer-intent up → You're harvesting demand, not creating it. Add PR and brand-building to create demand, not just capture it.
Brand up + Buyer-intent flat → Conversion or content issue. Fix product pages, checkout flow, and offers.
Both up → Add budget and fuel to winning levers.
Both down → Stop tweaking prompts. Fix positioning, PR, and product-market fit.
Metric 3: Category Entry Points and Prompt Visibility
Goal: Map real-world situations that trigger buying and the prompts they produce.
Understanding Category Entry Points:
CEPs are the specific situations that put buyers into your category. Strong CEPs combine: Specific occasion/pain + constraint + job to be done + timeframe.
Strong E-commerce CEP Examples:
"Planning outdoor wedding in summer, need comfortable heels that won't sink in grass"
"Baby's first birthday next month, looking for non-toxic, Montessori-style toys"
"Moving to first apartment, need complete kitchen setup under $500"
"Diagnosed with plantar fasciitis, need stylish work shoes with arch support"
Quarterly CEP Mapping:
List top CEPs (role, pain, job, timeframe, occasion). For each CEP, write 5-10 prompt families users would type in ChatGPT, Gemini, or Perplexity. Align landing assets to each CEP (buying guide, comparison, size guide, reviews page). Ensure distinctive brand assets (name, tagline, proof points, return policy) are consistent across all surfaces.
Monthly Prompt Visibility Testing:
Run qualitative checks in ChatGPT, Gemini, Claude, and Perplexity for each prompt family.
Log for each test:
Were you recommended?
What sources/citations and evidence types (PR, reviews, case studies, independent testing) were used?
What position and confidence level?
Score 0-2 per model per CEP:
0 = absent
1 = mentioned
2 = confident/top-3 with proof
Average scores to create your Prompt Visibility Index.
Improvement Actions:
Absent? Earn recommendations through PR placements, product reviews in major publications, independent testing (Wirecutter, Consumer Reports), customer stories framed by CEPs, influencer endorsements with substance.
Weak evidence? Publish credible proof (data, third-party validation, verified purchase reviews, product testing results) and get it referenced.
Remember: LLMs triangulate across signals to reduce uncertainty. They prefer corroboration from credible sources.
As this is a long guide, you can find the rest in this free SOP gift here.
Do You Love The AI For Ecommerce Sellers Newsletter?
You can help us!
Spread the word to your colleagues or friends who you think would benefit from our weekly insights 🙂 Simply forward this issue.
In addition, we are open to sponsorships. We have more than 48,000 subscribers with 75% of our readers based in the US. To get our rate card and more info, email us at [email protected]
The Quick Read:
In case you decided to digitally detox yesterday, you might have missed out the internet breaking
State of AI 2025 finds OpenAI still ahead, China closing fast, RL and agents maturing, bio and robotics accelerating, NVIDIA dominant, safety funding thin, adoption booming, capability per dollar compounding.
AWS unveils Amazon Quick Suite, an agentic hub that links your data, builds custom agents, runs research, and automates workflows with enterprise guardrails.
Dia arrives on Mac, a sleek browser with a built-in AI that drafts, compares open tabs, and studies alongside you without leaving your workflow.
A really interesting research from the Digital Shelf Institute about the Ecom organisation of the future and how AI fits in it. Page 38 specifically outlines a very interesting model for org structure in the age of AI agents.
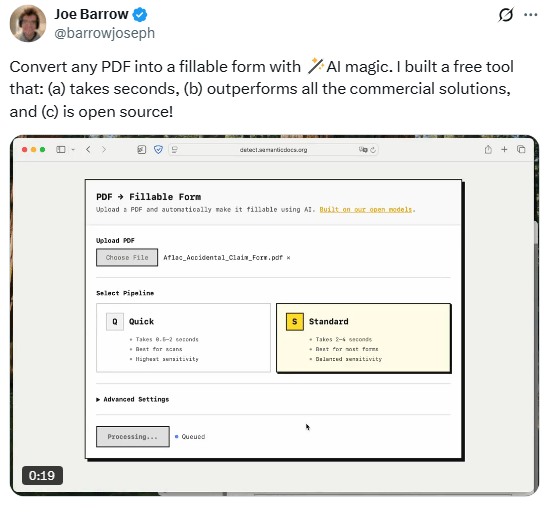
Turning PDFs into fillable forms with this this simple and free AI tool.
Google brings Nano Banana to Lens and AI Mode, letting you generate or edit images on the fly, rolling out in the US and India with more regions coming.
Google adds AI previews in Discover and a What’s new feed in Search for sports, helping fans catch trending updates with direct links to publishers.
IMF projects global growth easing to 3.2% in 2025 and 3.1% in 2026 as tariffs and supply strains bite, with the US slowing, Europe inching up, China cooling.
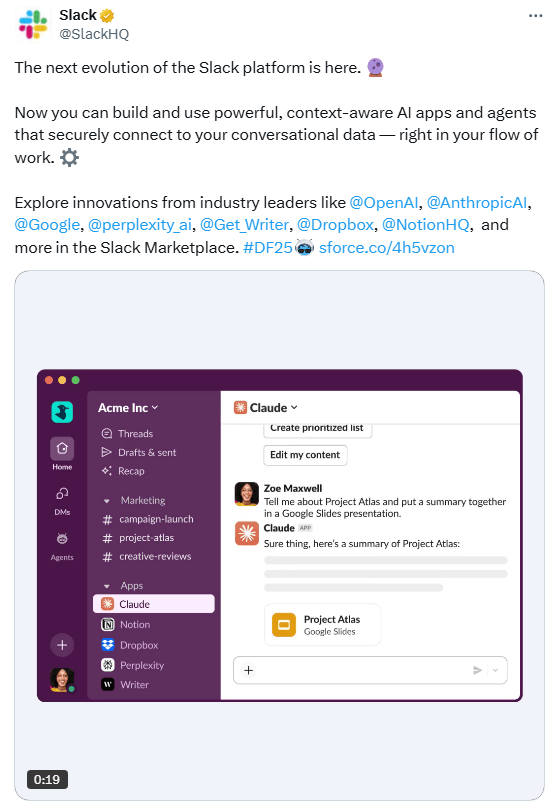
Slack now provides the option of creating your own agents that connect to your conversational data, making work chats easier.
Google ships Veo 3.1 and 3.1 Fast in paid preview with richer native audio, better prompt control, stronger image-to-video, reference images, scene extension, and first-to-last frame transitions.
Today’s Content Spotlight:

The Tools List:
📲 OpenArt - App store for AI image apps.
🎨 Moodboard Creator - AI-driven branding kickstarter
⚙️ Trellis: AI-powered eCommerce merchandising software, optimising Amazon and Walmart ads for product content, pricing, placement, and promotion.
📊 Simple Analytics: Get insights about your business by chatting with your analytics in real-time using AI.
❄️ Snowball - Simplify your content creation with AI assistance
⌨️ Quicky AI - Use AI on any website instantly just by selecting text
About The Writer:

Jo Lambadjieva is an entrepreneur and AI expert in the e-commerce industry. She is the founder and CEO of Amazing Wave, an agency specializing in AI-driven solutions for e-commerce businesses. With over 13 years of experience in digital marketing, agency work, and e-commerce, Joanna has established herself as a thought leader in integrating AI technologies for business growth.
For Team and Agency AI training book an intro call here.